
A campaign dashboard can show a low cost per lead, an acceptable cost per action and a high return on ad spend at the same time. Yet the business can still lose money. The problem is not always poor performance. Often, the team is using a metric that answers a different question from the decision it needs to make.
This guide connects lead cost, conversion cost, customer acquisition cost, advertising revenue and marketing profit in one measurement chain. You will see where each metric begins and ends, which costs belong in it, and how to stop a cheap top-of-funnel result from hiding weak customer economics.
Which marketing metric should you use?
Choose the metric from the stage and cost scope of the decision. If a marketer is deciding which lead form produces valid inquiries, CPL may be appropriate. If a manager is deciding whether the company can afford to keep acquiring customers, CAC, contribution, payback and lifetime value matter more.
| Decision | Primary metric | Use with | Main blind spot |
|---|---|---|---|
| Are we generating leads efficiently? | CPL | Valid-contact and qualification rates | Lead quality and sales are not represented. |
| What does a chosen conversion action cost? | CPA | Conversion definition and value | The action may not be a customer or sale. |
| What does a new customer really cost? | CAC | Contribution CLV and payback | Average CAC can hide channel and cohort differences. |
| How much attributed revenue did advertising return? | ROAS | Margin and break-even ROAS | Revenue is not profit. |
| Did the broader marketing investment create value? | Marketing ROI | Attribution, cost policy and cash timing | Simple ROI can omit long-term or unmeasured effects. |
Therefore, the metric should become more financially complete as the decision becomes more consequential. A creative test may use click-through rate and CPL. A quarterly budget decision should reach customers, contribution, total acquisition cost and cash recovery.
CPL vs CPA vs CAC vs ROAS vs ROI: definitions and formulas
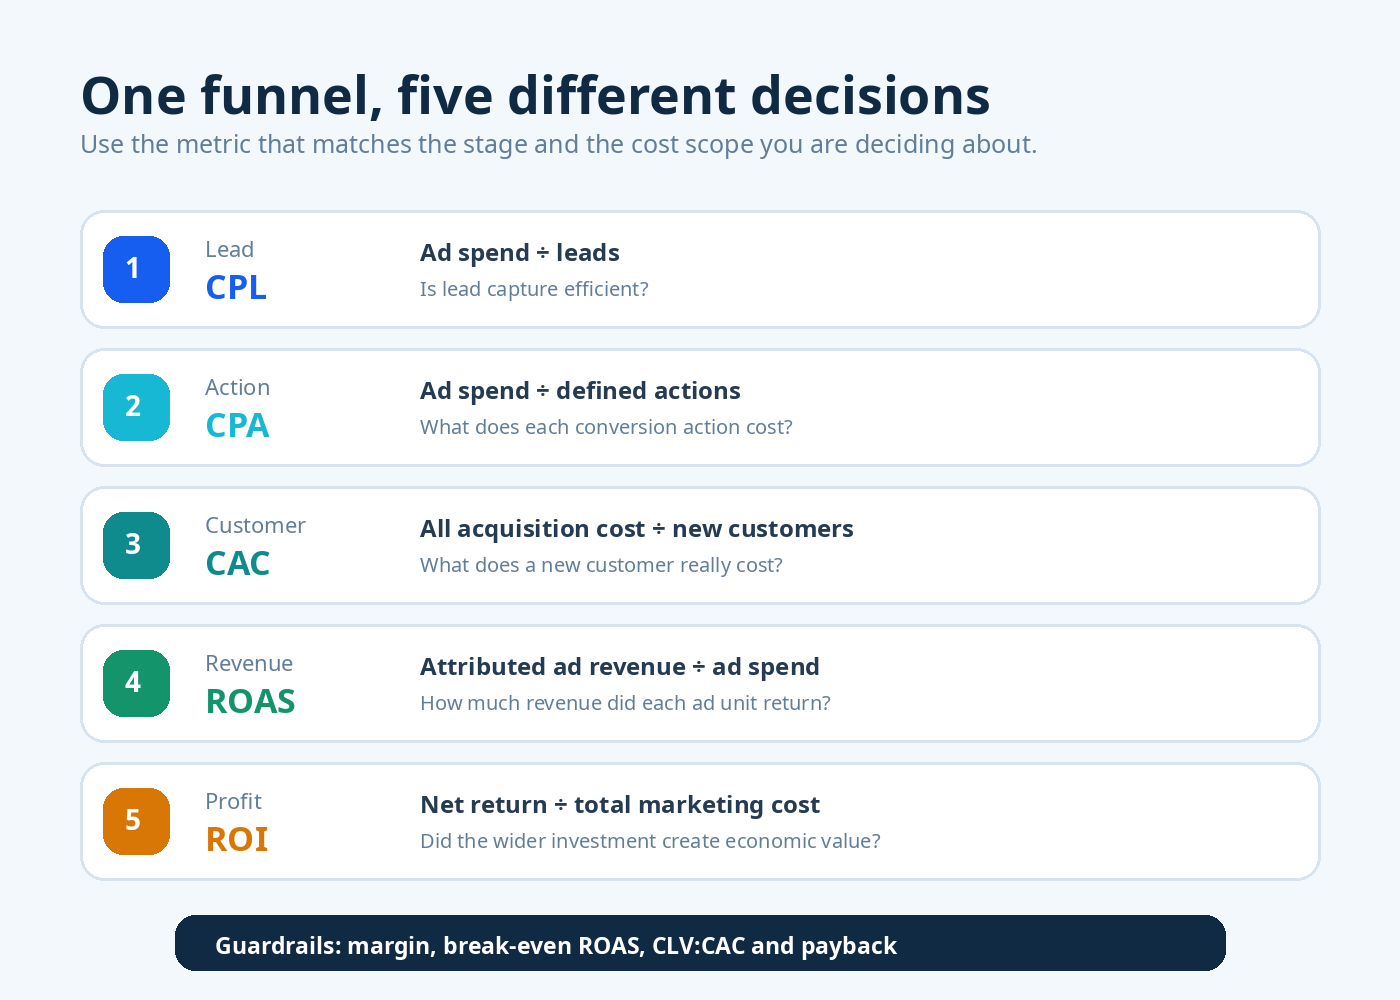
These metrics sit at different points in the same commercial journey. Their formulas are simple. However, the definitions inside each numerator and denominator decide whether the result is useful.
CPL measures the cost of a defined lead
Cost per lead = selected campaign cost ÷ leads generated. A lead might be a form submission, call, message or another captured inquiry. Because those records can differ greatly, every report should say whether it counts raw, valid or qualified leads.
For example, $2,000 of spend and 100 raw leads produces a $20 raw CPL. If only 40 records meet the qualification rule, cost per qualified lead is $50. The first number describes capture volume; the second moves closer to commercial value.
Use the Artsians CPL Calculator to calculate unit cost, reverse-plan spend from a lead target or estimate lead volume from an available budget.
CPA measures the cost of a defined action
Cost per action or acquisition = ad spend ÷ counted actions. Google Ads defines average CPA as total cost divided by total conversions. Still, the business controls what a conversion means. It could be a purchase, booked call, app install, signup or another valuable action.
Consequently, a £30 CPA for booked consultations is not the same as a £30 cost per new customer. If 60 consultations are booked but only 40 attend, the cost per attended consultation is higher. Name the action beside the metric so readers do not silently reinterpret it.
The Artsians CPA Calculator can calculate CPA, revenue per action and ROAS from one documented conversion definition.
CAC measures the broader cost of a new customer
Customer acquisition cost = included sales and marketing acquisition costs ÷ new customers acquired. A fully loaded CAC may include media, sales and marketing payroll, commissions, agencies, creative production, software and other acquisition costs. A media-only customer cost includes less.
Both views can be useful if they are labelled correctly. Media-only CAC helps campaign optimisation. Meanwhile, blended or fully loaded CAC supports staffing, cash-flow and growth decisions. Do not compare a narrow channel figure with a broad company figure as though they use the same cost policy.
Use the Artsians Customer Acquisition Cost Calculator to record the included cost categories and calculate an all-in average.
ROAS measures attributed revenue efficiency
ROAS = attributed advertising revenue ÷ ad spend. A 4.0x ROAS means four currency units of attributed revenue for each unit spent on advertising. It does not mean the company earned three units of net profit.
Product cost, fulfilment, transaction fees, refunds, payroll, agencies and overhead may sit outside ad spend. As a result, a high ROAS can still be below the business’s break-even level when margins are thin.
First, check actual revenue and spend with the Artsians ROAS Calculator. Next, enter the contribution available before advertising in the Break-even ROAS Calculator. Break-even ROAS equals one divided by contribution margin as a decimal. A 40% contribution margin therefore produces a 2.5x media break-even threshold before excluded fixed costs and desired profit.
Marketing ROI measures net return against wider investment
Marketing ROI = net marketing return ÷ total included marketing cost × 100. In this article, net return equals attributed contribution after delivery cost minus media and other included marketing costs.
ROI becomes misleading when one report uses gross revenue as return while another uses gross profit. It also changes when cost scope changes. Therefore, record the return definition, cost policy, attribution model, reporting period and calculation date beside the percentage.
The Artsians Marketing ROI Calculator converts attributed revenue into gross profit using the chosen margin, subtracts marketing and additional campaign costs, and reports net return and ROI.
Worked example: connect the full marketing measurement chain
Consider an illustrative service campaign. The business spends $6,000 on ads and another $2,000 on creative, software and campaign delivery. It receives 300 raw leads, records 90 booked consultations and wins 30 new customers. Each new customer produces $600 of first-sale revenue, while contribution margin before acquisition cost is 60%.
| Input | Illustrative value | Definition |
|---|---|---|
| Media spend | $6,000 | Advertising cost only |
| Other acquisition cost | $2,000 | Creative, software and campaign delivery |
| Raw leads | 300 | Captured inquiries before qualification |
| Booked consultations | 90 | The chosen CPA action |
| New customers | 30 | First-time paying customers |
| First-sale revenue | $18,000 | 30 customers × $600 |
| Contribution margin | 60% | After selected variable delivery costs, before acquisition |
Calculate the stage metrics
- Raw CPL: $6,000 ÷ 300 = $20.
- Booked-consultation CPA: $6,000 ÷ 90 = $66.67.
- Media-only customer cost: $6,000 ÷ 30 = $200.
- All-in CAC: ($6,000 + $2,000) ÷ 30 = $266.67.
- ROAS: $18,000 ÷ $6,000 = 3.0x.
- Attributed contribution: $18,000 × 60% = $10,800.
- Net marketing return: $10,800 − $8,000 = $2,800.
- Marketing ROI: $2,800 ÷ $8,000 × 100 = 35%.
The same campaign can truthfully report $20 CPL, $66.67 CPA, $266.67 all-in CAC, 3.0x ROAS and 35% marketing ROI. Those numbers are not competing answers. Instead, each describes a different stage or cost scope.
Add lifetime value without ignoring cash timing
Suppose the average customer is expected to buy three times over the relationship at $600 per purchase and the same 60% contribution margin. Simplified margin-adjusted customer lifetime value would be:
$600 × 3 purchases × 60% = $1,080 contribution CLV.
The simplified CLV:CAC ratio is $1,080 ÷ $266.67, or about 4.05x. However, this estimate does not guarantee three purchases. Moreover, the business pays acquisition cost now and may receive repeat contribution months or years later. Use the Artsians Customer Lifetime Value Calculator to test conservative lifespan, purchase frequency and margin scenarios rather than relying on one optimistic average.
Why a lower CPL can produce worse marketing economics
Teams often reduce CPL by widening targeting, weakening form questions or offering an incentive that attracts people with little purchase intent. Lead volume rises, so the platform appears more efficient. Downstream conversion can fall at the same time.
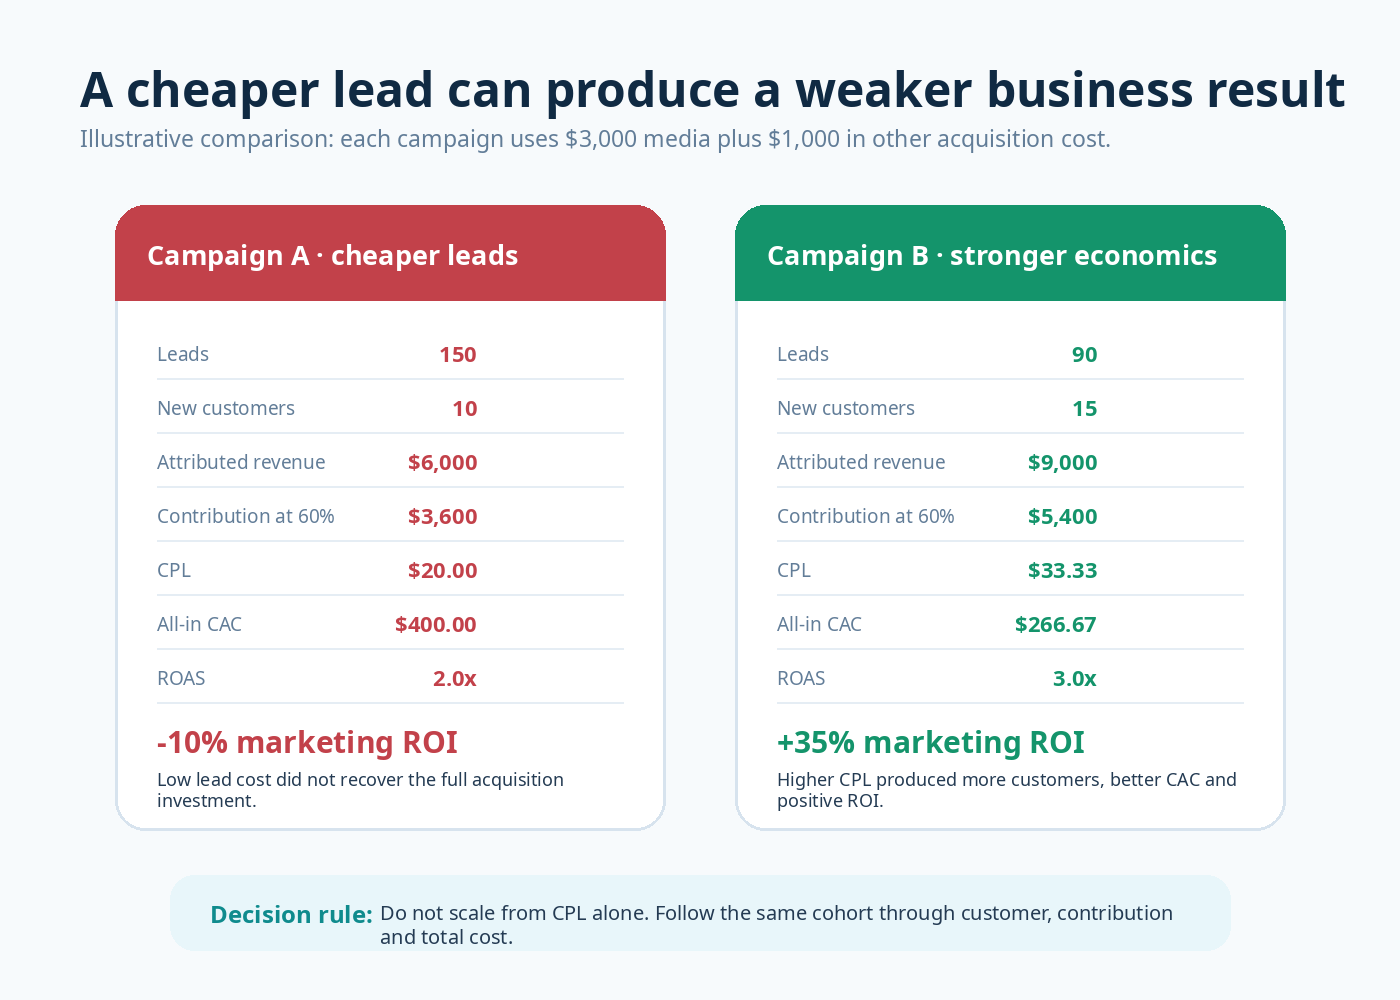
In the comparison, both campaigns use $3,000 of media and $1,000 of other acquisition cost. Campaign A generates 150 leads at $20 each, while Campaign B generates only 90 leads at $33.33. If the analysis stops there, A wins.
However, A produces 10 customers and B produces 15. Consequently, all-in CAC is $400 for A and $266.67 for B. At $600 revenue per customer and a 60% contribution margin, A returns negative 10% marketing ROI while B returns positive 35%.
The decision rule is simple: optimise the earliest metric that still predicts the business outcome reliably. A lead-generation algorithm may need enough volume to learn, but the management dashboard should continue through valid leads, qualified opportunities, customers, contribution and total cost.
Which metrics matter for different business models?
The metric chain remains the same, although the most useful guardrail changes by business model. Choose a primary operating signal and a financial validation metric.
| Business model | Useful operating metric | Financial validation | Important caution |
|---|---|---|---|
| Local lead-generation service | Cost per qualified lead or attended appointment | CAC and first-sale contribution | Raw form CPL can hide unreachable or unsuitable inquiries. |
| High-ticket consultation | Cost per attended consultation | CAC, close rate and payback | A long sales cycle makes recent monthly CAC unstable. |
| Ecommerce | Purchase CPA and ROAS | Break-even ROAS, contribution and ROI | Discounts, refunds, shipping and fees can erase apparent return. |
| Subscription or repeat purchase | New-customer CAC | Contribution CLV:CAC and payback | Lifetime value is uncertain and cash arrives later. |
| Content or brand campaign | Qualified engagement or assisted action | Incrementality, pipeline influence and blended ROI | Short last-click windows can omit genuine long-term effects. |
For a small business, simplicity is valuable. Still, simple should not mean stopping at the easiest number. Use one clearly defined leading indicator for frequent optimisation and one downstream financial metric for budget approval.
Build a practical marketing metrics dashboard
A useful dashboard does not need every platform column. It needs a chain that lets the team trace a change from spend to business outcome. Keep source data separate, then reconcile it on an agreed cadence.
Weekly operating view
- media spend by campaign and channel;
- raw leads and raw CPL;
- valid-contact and qualification rates;
- qualified leads, booked actions and stage-specific CPA;
- conversion lag and unresolved records; and
- tracking or follow-up exceptions.
This view helps teams correct broken forms, weak lead quality, delayed responses or tracking failures. Nevertheless, it should not declare profit before enough customers and revenue have matured.
Monthly or cohort financial view
- new customers, media-only customer cost and all-in CAC;
- attributed revenue, contribution and ROAS;
- break-even ROAS and target buffer;
- net marketing return and ROI;
- refunds, cancellations and delayed sales; and
- CLV:CAC and payback where repeat behaviour is supported by evidence.
Use cohorts when the sales cycle crosses reporting periods. For instance, leads captured in January may become customers in February. A strict calendar-month ratio can make January look expensive and February look unusually efficient unless the business follows the same acquisition cohort.
Minimum record for every reported metric
Save the metric name, formula, cost scope, conversion definition, attribution source, attribution window, date range, currency and calculation date. Also record whether the result is platform-reported, analytics-reported, CRM-confirmed or finance-reconciled.
Google Analytics now distinguishes key events used for behavioural analysis from conversions used to measure and optimise ad performance. Therefore, confirm which event or conversion feeds each report. A dashboard label such as “conversions” is incomplete without the underlying action and counting rule.
Protect the calculation from attribution and data-quality errors
Mathematically correct ratios can still support a poor decision. Before comparing campaigns, confirm that the inputs describe compatible periods, events and customer groups.
Use one definition per funnel stage
Separate raw leads, valid contacts, qualified opportunities, booked appointments, attended appointments and paying customers. Do not rename an early event “acquisition” simply because the advertising platform calls it a conversion.
Match costs with outcomes
A daily spend figure should not be divided by customers who required several months to close. Likewise, lifetime revenue should not be compared silently with one month of ad spend. Match the time horizon or label the mismatch as an assumption.
Deduplicate customers and channel credit
Meta, Google, email and analytics tools may each claim the same sale under their attribution settings. Summing platform-attributed conversions can therefore exceed actual customers. Use the CRM or transaction system to deduplicate outcomes, then apply an agreed attribution view.
Keep revenue, contribution and cash separate
Revenue measures sales. Contribution subtracts selected variable delivery costs. Cash timing shows when money is actually received and paid. A positive lifetime-value model may still create a short-term cash problem when acquisition cost is immediate and contribution arrives slowly.
Turn the metrics into better budget decisions
Metrics are useful when they trigger a defined action. Establish increase, hold, investigate and stop rules before the campaign consumes the full budget.
| Observed pattern | Likely interpretation | Next check |
|---|---|---|
| Low CPL, weak qualification | Campaign attracts volume outside buying criteria. | Targeting, offer, form questions and lead definition |
| Good CPA, high CAC | The chosen action does not convert to customers efficiently. | Attendance, sales process, close rate and lag |
| High ROAS, weak ROI | Margin or non-media costs consume the apparent return. | Variable cost, refunds, agencies, software and payroll |
| Strong CLV:CAC, slow payback | Long-term value may be attractive but cash recovers slowly. | Retention evidence, cash runway and payment timing |
| Strong platform metrics, weak CRM sales | Attribution, lead quality or offline follow-up may be broken. | Deduplication, conversion imports and sales-stage records |
If your immediate task is planning Meta lead volume, use the companion Artsians guide to Meta ads budgets for small businesses. It reverse-calculates raw leads, qualified leads, customers and maximum affordable CPL. This article then helps you choose the metric that should govern the later decision.
Marketing measurement checklist
- Define the business decision before choosing the metric.
- Write the numerator, denominator and included costs.
- Name the lead, action and customer stages precisely.
- Use compatible periods, currencies and attribution windows.
- Follow the same cohort from capture to customer.
- Apply contribution margin before calling revenue profitable.
- Compare ROAS with break-even ROAS and total cost.
- Use contribution CLV and payback cautiously for repeat customers.
- Reconcile platforms with CRM and finance records.
- Set scale, hold and stop rules before spending.
CPL, CPA, CAC, ROAS and ROI: frequently asked questions
Metric selection and definitions
Which marketing metric is best for lead generation?
Use CPL for captured lead efficiency, then add valid-contact rate, qualification rate and a downstream customer metric. Cost per qualified lead or attended appointment may be more useful than raw CPL when lead quality varies. Budget approval should eventually reach CAC, contribution and ROI.
Is CPA the same as CAC?
No. CPA usually divides advertising cost by a defined conversion action, which might be a booking, signup or purchase. CAC focuses on new customers and may include broader sales and marketing costs such as payroll, agencies, software and creative work.
Is a low CPL always good?
No. A low CPL can come from invalid, unqualified or low-intent inquiries. Compare raw CPL with valid and qualified CPL, then follow those leads to customers, contribution and total acquisition cost. A higher-CPL source can produce better CAC and ROI.
Is ROAS the same as marketing ROI?
No. ROAS divides attributed advertising revenue by ad spend. Marketing ROI compares net return with the selected wider marketing investment. ROAS can look strong while ROI remains weak because revenue does not automatically subtract product, delivery, agency, software or payroll costs.
Profitability and reporting
What is a good ROAS?
There is no universal good ROAS. The required level depends on contribution margin, refunds, operating costs, repeat purchases and desired profit. Calculate break-even ROAS from the margin available before advertising, then add a safety and profit buffer appropriate to the business.
Should CAC include salaries and software?
Include them when the decision requires a fully loaded or blended acquisition cost and the costs support customer acquisition. A narrower media-only customer cost is also useful for campaign optimisation. Label both figures and keep the inclusion policy consistent over time.
Can lifetime value justify a higher CAC?
Sometimes, but only when retention, purchase frequency, margin and cash timing are supported by credible cohort data. Use contribution CLV rather than revenue alone, test conservative scenarios and calculate payback. Do not use optimistic lifetime revenue to excuse an uneconomic first sale automatically.
How often should marketing metrics be calculated?
Review operational indicators such as spend, leads and qualification weekly when volume supports it. Reconcile customers, contribution, CAC and ROI monthly or by acquisition cohort at a cadence that matches the sales cycle. Avoid final conclusions before delayed conversions and refunds have matured.
Use the metric that reaches the decision
CPL, CPA, CAC, ROAS and ROI do not compete for one winning position. They form a measurement chain. CPL shows lead capture cost. CPA prices a defined action. CAC reaches the customer. ROAS reports attributed advertising revenue efficiency. ROI asks whether the wider investment produced net value.
Start with the earliest metric your team can influence, but do not end there. Follow compatible cohorts, apply margin, include the correct costs and validate the result against customer value and cash recovery. That is how a dashboard moves from reporting activity to supporting a business decision.
Sources and further reading
- Google Ads Help: Average CPA definition
- Google Ads Help: CPA, ROAS and ROI glossary
- Google Ads Help: About return on investment
- Google Analytics Help: Conversions versus key events
- Artsians CPL Calculator
- Artsians CPA Calculator
- Artsians Customer Acquisition Cost Calculator
- Artsians Customer Lifetime Value Calculator
- Artsians ROAS Calculator
- Artsians Break-even ROAS Calculator
- Artsians Marketing ROI Calculator
Comments